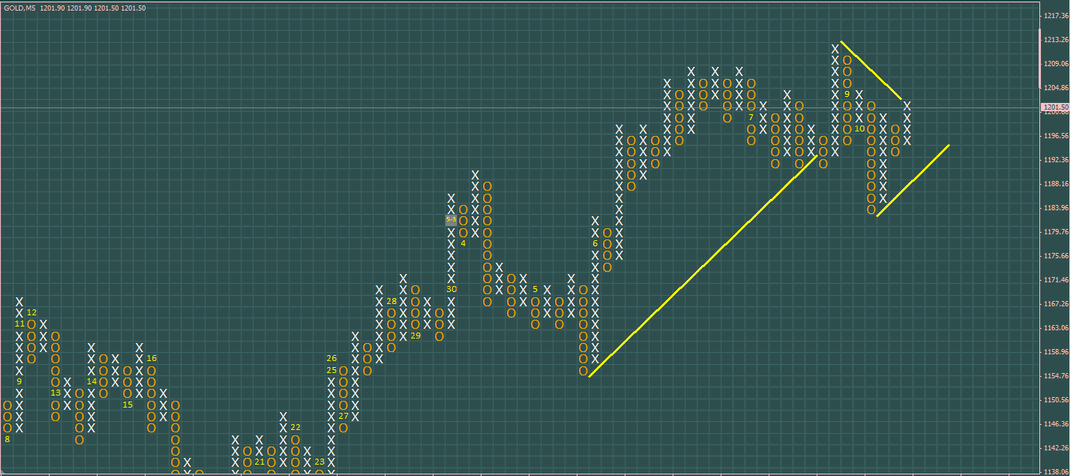
In point-and-figure charting, you buy when the new price surpasses the highest X in the previous X column, and you sell when the new price surpasses the lowest low O in the previous O column. When the price surpasses a previous high or low, you have a breakout.